Designing a DAQ for a formula student race car
Formula SAE is a student design competition in which a prototype race car is evaluated for its potential as a production item. In 2010, I got the chance to lead the electronics team of Orion Racing India (the FSAE team from K. J. Somaiya College of Engineering). Our joint efforts resulted in a DAQ (Data Acquisition System) and a Color LCD driver interface which was selected among the top 8 out of 78 international teams for the “Most Innovative use of Electronics Award” at FSG 2010.

The DAQ could log data from 18 sensors @36Hz (we were initially looking at 2Hz with the GPS on-board! More on that later) and could control the coolant pump and radiator fan based on sensor readings. Crucial data was relayed to the Color LCD screen mounted on the steering wheel. A lot of DAQ systems do exist in the market and you can call this re-inventing the wheel, but when one is young, the learning experience is worth the effort. In this blog post I’ll discuss the tech details of the DAQ, some useful tools/approaches and the problems we faced.
A well defined design procedure always helps you reduce the overall development time. We had learn’t this first hand from our tronics seniors @Orion. The first stage involved simulation and modeling. In comes Proteus ISIS, a tool which we used extensively to test everything, right from basic fundae of voltage drop on open resistor terminals to differential amplifier gains and serial bus communication protocols.
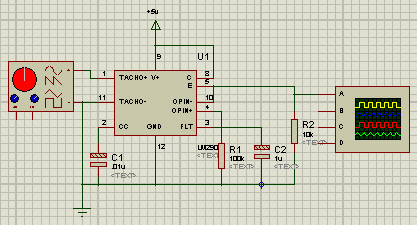
Next we tested these circuits on breadboard. Apart from verifying the operation, breadboard testing also helps to visualize circuit design since most of the components we were using would be going on our final PCBs. We then fabricated low cost prototype PCBs to test the more crucial components like GPS receivers and micro-controllers.
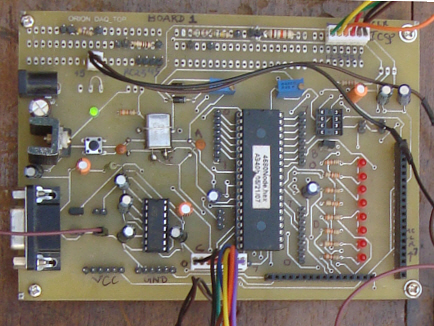
Finally, we got the shiny green DAQ PCB boards made. Smiles smiles ^__^
SENSOR REQUIREMENTS, CALIBRATION
Sensors are responsible for conversion of various mechanical parameters into measurable electrical quantities. The sensor selection for every team changes with its design goals. Typical sensors implemented by most teams include three axis accelerometers and sensors to detect wheel speed, shock travel, steering angle, manifold air pressure, coolant temperature, throttle position and gear position.
Accelerometer
The MMA7260Q, low cost three axis capacitive micro machined accelerometer was selected to monitor the vehicle accelerations. It features signal conditioning, a single-pole low pass filter, temperature compensation and selectable sensitivity (1.5g/2g/4g/6g). Its capacitive approach offers several benefits when compared to the piezoresistive sensors used in many other accelerometers, notably a wider temperature range and response to DC as well as dynamic vibrations. The sensor outputs voltages proportional to the experienced g-force.
Wheel speed sensor
Wheel speed is sensed using an NPN type inductive proximity sensor. As a tooth on the wheel passes by the sensor, a pulse is generated in a recurring manner. The pulse train will increase in frequency as the vehicle speeds up and decrease as the vehicle slows down. Therefore, a frequency to voltage converter, LM2907 was used to convert the generated frequency into a corresponding output voltage.
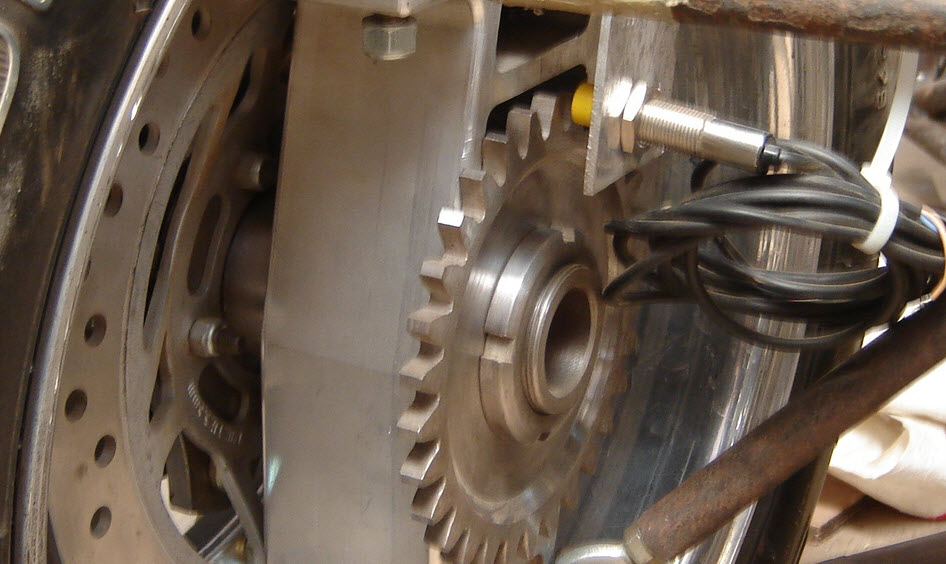
Low cost inductive proximity sensors have a maximum switching frequency of approximately 600Hz. Assuming maximum vehicle speed to be 120km/hr, the number of teeth in the toothed wheel was selected to be 30.
Shock travel sensor
Suspensions play a key role in the vehicle dynamics of a race car. Knowledge of the linear displacement of the shocks for a particular damping setting is critical in evaluating the damping performance in various loading scenarios. Shock travel sensors used to measure these linear displacements are available in two types: wire wound and conductive plastic. Conductive Plastic (CP) displacement sensors are free from hysteresis and hence recommended. We got the wire wound ones (cheaper 😛 ).
Steering angle sensors
A rotary potentiometer was housed inside the steering rack housing and attached to the steering column to measure the steering angle. Yeah we did use a lot of potentiomenters (cheaper!). If possible, I would recommend using non-contact based sensors (LVDT, capacitive, etc.) so that they won’t be worn out over time.
Gear position sensor
For the purpose of gear position indication, a small gear is meshed with the gear drum in the engine. A high quality potentiometer shaft is rotated accordingly by the gear drum using this arrangement. Distinct voltage levels can be obtained for each position.
Fuel level sensor
A typical fuel gauge comprising of a float that is mounted on the end of a pivot arm was used as a fuel level sensor. The resistance of the fuel gauge changes as the float moves up and down with the fuel level. Errors introduced in the readings due to fuel slosh were reduced by implementing a moving average filter with a window size of 15.
Coolant temperature sensor
Two negative temperature co-efficient thermistors with brass housing and a temperature range of -40 degree C to 135 degree C were used to measure the coolant temperature.
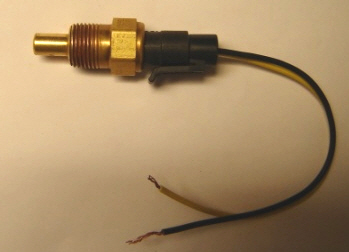
A potential divider network was implemented to get the required output voltage swing. A second order logarithmic curve was fitted to the response of this sensor. (MATLAB).
All of the sensors mentioned above need to be calibrated. By that I mean the sensors should be taken from the minimum to maximum reading possible and other way round (to account for hysteresis) over multiple iterations. The procedure should be well documented, so that every iteration is exactly the same as previous one. Only then the resultant data should be used for translating sensor reading to derived units.
SUPPORTING HARDWARE
Cooling control board:
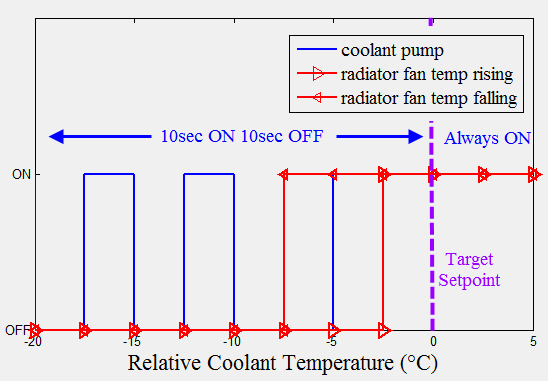
Every engine is designed to work at maximum efficiency in a certain temperature range. The devices which can be controlled to maintain the engine in the specified temperature range are the coolant pump and the radiator fan. The cooling team provided us with three temperature set-points: 75, 80 and 85 degree C, which can be selected by the driver.
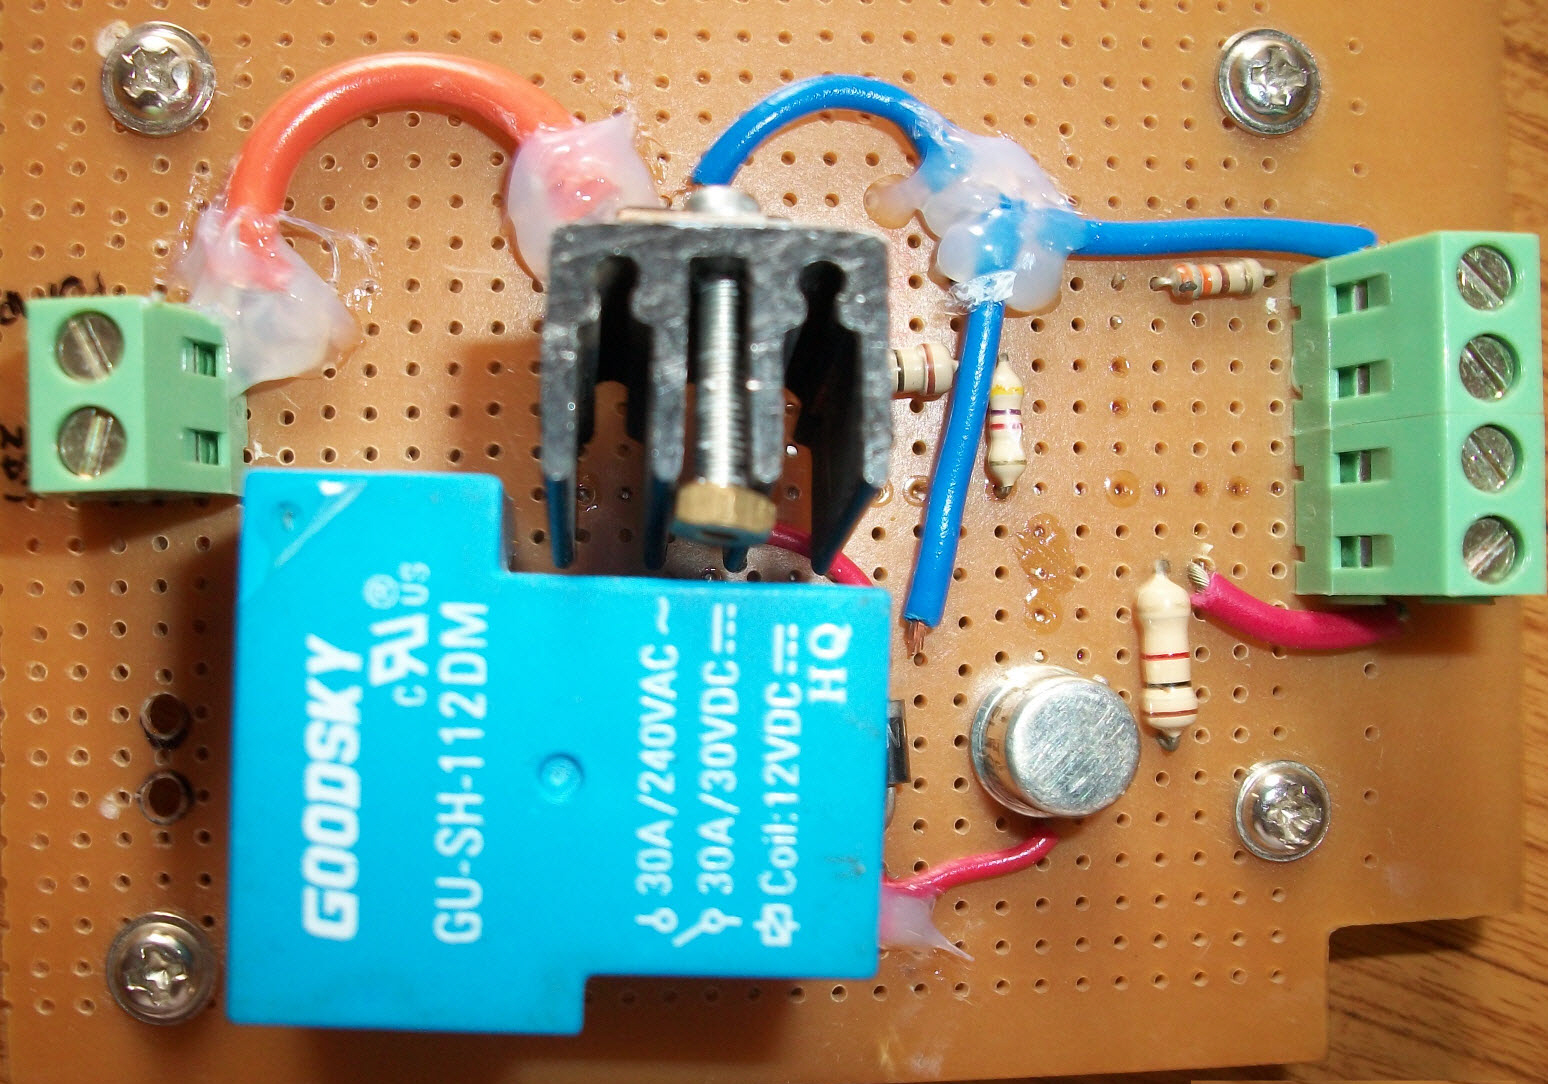
The hardware used to regulate the engine temperature comprises of a Goodsky GU-SH-112DM relay, used to control the radiator fan and an IRFZ48 power MOSFET, used to control the coolant pump. The control signals generated based on the set point are as shown.
Power card:
A noise free, light weight power supply is an essential requirement of a portable DAQ System. We designed a power Card based on low cost linear voltage regulators and equipped with features like surge voltage protection (using Metal Oxide Varistors), over current protection (using Polymeric Positive Temperature Coefficient fuses), reverse voltage and over voltage protection (using silicon avalanche diodes). However, I would recommend using switching supplies. I talk more about this in my other blog post.
DAQ v1:
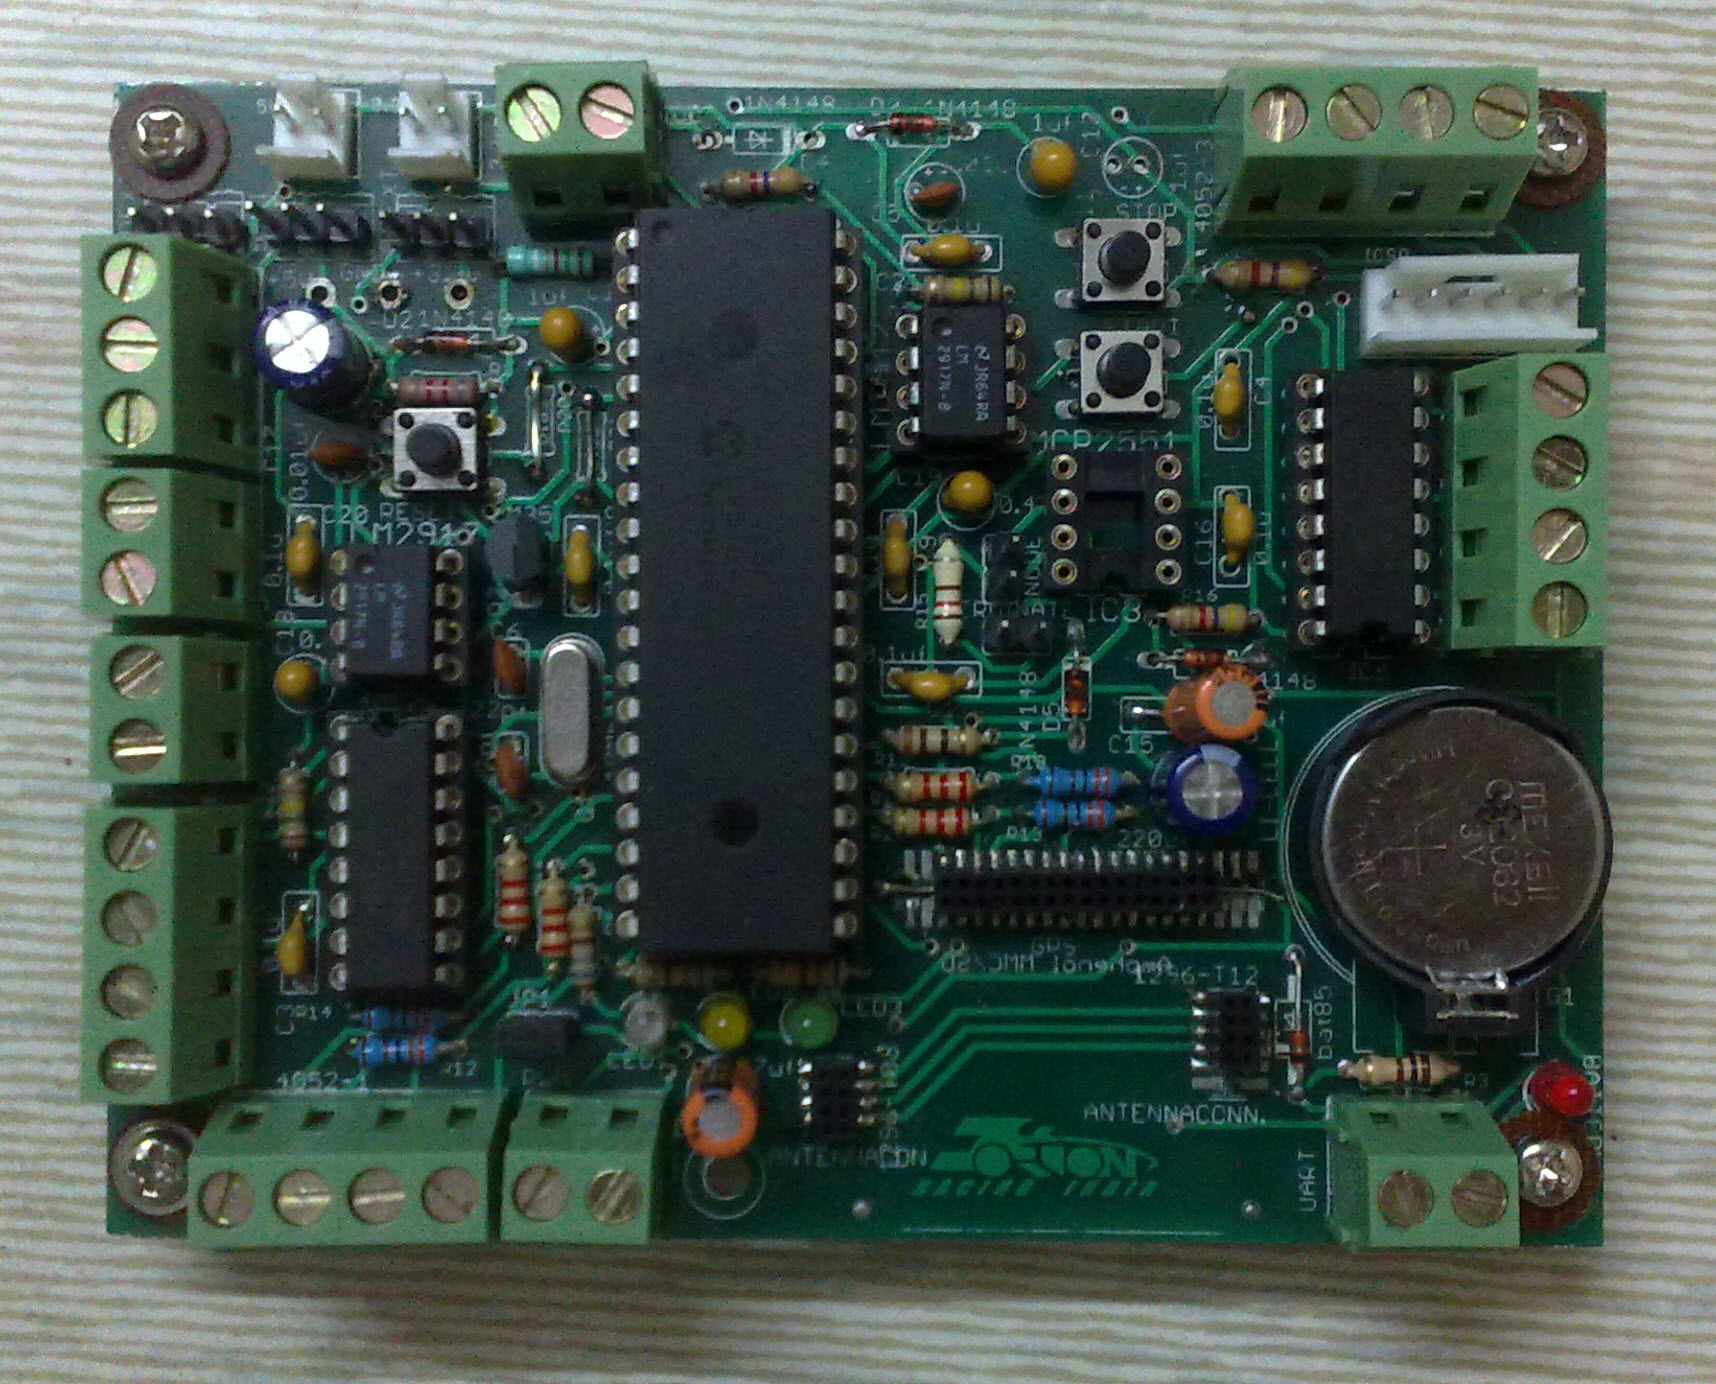
The DAQ v1 was built around a PIC18F4680 microcontroller. It was designed as a stand-alone system, so as to be exempted from the cost report at the competition. The PIC18F4680 runs in HSPLL (High Speed Phase Locked Loop) mode under which a PLL multiplies the oscillator output frequency of 10MHz by 4 to get maximum possible operating frequency of 40MHz. The10bit ADC channels on PIC were expanded using analog multiplexers (CD4052). A temperature sensor in the form of LM-35 was included to ascertain that the operating temperature was within the hardware limits. CAN interface was provided using MCP2551 CAN transceiver. The firmware for DAQ v1 was developed using embedded C.
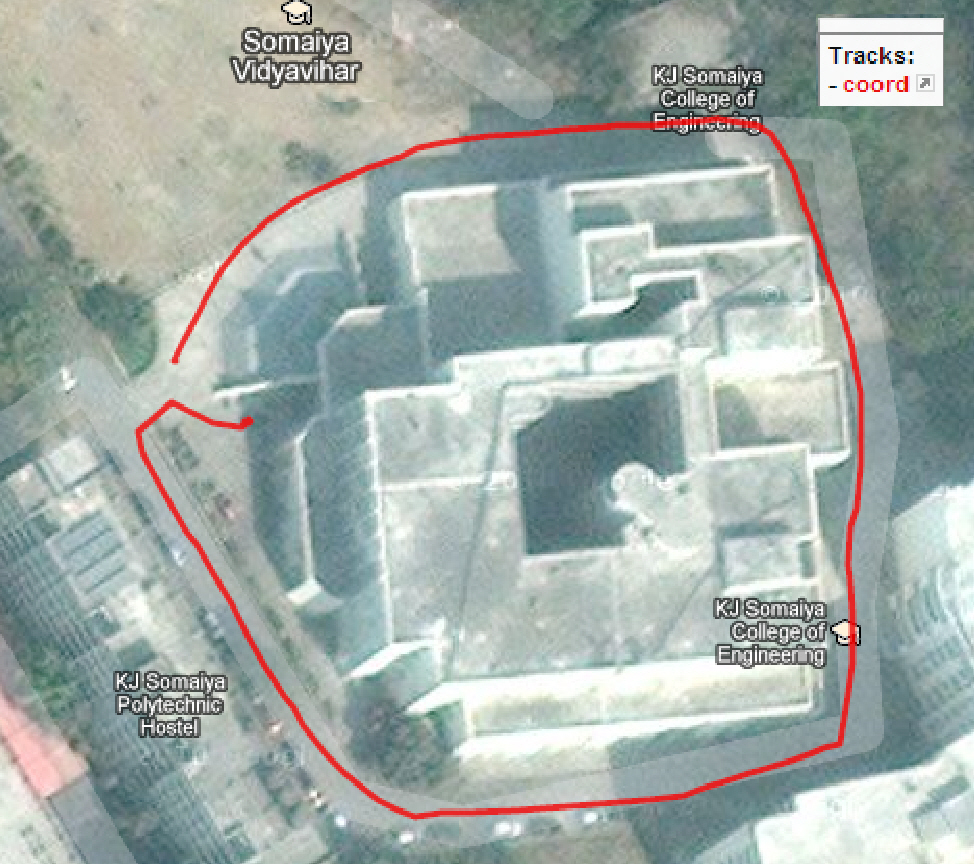
The CP3838 GPS (Global Positioning System) module was selected (rather sponsored, so selected 🙂 ) to satisfy the vehicle tracking requirements. Data recorded from the GPS receiver played a significant role in validating sensor data. The track shown was plotted using co-ordinates recorded from the GPS receiver. Interface to an MMC/SD card for logging sensor and GPS data was provided via SPI (Serial Peripheral Interface). The data is stored in as comma separated value file format which can be easily imported into MATLAB for analysis. A logging rate of 33Hz was recorded for 14 sensors interfaced to the module.
I mentioned before that we had a logging rate of 2Hz initially. This was because we were doing all conversions from sensor ADC values to derived parameters on the micro-controller before logging into SD card. Floating point operations require computational power and this translates into conversion time for a slower 8-bit micro-controller. A simple software change to log readings directly helped us notch up the logging rate! Batching of data would have helped improve this even more (but I realised that 2 years later! 😛 ).
DAQ v2:
The DAQ v1, although a fully functional stand alone system, was reliant on GPS for generating time-stamps. The 10bit ADC of PIC18F4680 could not provide the degree of precision required by the team. In addition, the analog multiplexer introduced a series resistance of 270ohm and a delay varying from 500-1000ns (nanosecond) on the signal acquisition line. Hence, a real time clock (DS1307) was introduced on-board to get time-stamps at higher frequency and three 12-bit ADCs (TLV2553) were interfaced via SPI to get a higher resolution of the sensor data. The DAQ v2 also features fourth order Sallen-key based low pass filters and transient voltage suppressors for noise suppression and anti-aliasing. A logging rate of 36Hz was recorded for 18 sensors.

Analog filtering was used to remove extraneous noise from the signal lines (thanks Mr. Claude Rouelle for his suggestions). In the absence of an analog filter, signals outside half of the sampling bandwidth of the ADC are aliased back into the signal path. Once a signal is aliased during the digitalization process, it is impossible to differentiate between noise with frequencies in band and out of band. The signal-to-noise ratio of the 12-bit ADC is 74dB and the bandwidth of interest for the analog signal is DC to 1 kHz. Hence, a 4-pole low pass filter was designed to provide an attenuation of 80dB/decade with a cut-off frequency of 1 kHz.
We also tried to spend some time on telemetry but the transcievers we selected did not have sufficient range. For all the readers I would recommend using Maxstream 9XTend or Microhard n920 if they wish to have telemetry. We used MATLAB to develop GUI for analyzing the logged data, but with the car manufacturing being delayed we did not have much time to record/analyze/tune vehicle performance. From my experience I now feel that a benchmark DAQ would have been useful to test and tune the module better because whatever data we captured, there was no way of concluding that it was accurate enough. You can find the wiring layouts for these modules here.